Times Tables, Mandelbrot and the Heart of Mathematics
Mathologer4 HN recommenders · 2017–2023
2.8M views · explainer · evergreen · Uploaded 2015-11-06
Mathologer shows how times table diagrams on a circle produce cardioids and other curves connected to the Mandelbrot set. He explains the patterns and links to a tool for making your own diagrams.
HN recommends it as the clearest explanation of the patterns behind modular multiplication diagrams and times table art.
 9:52
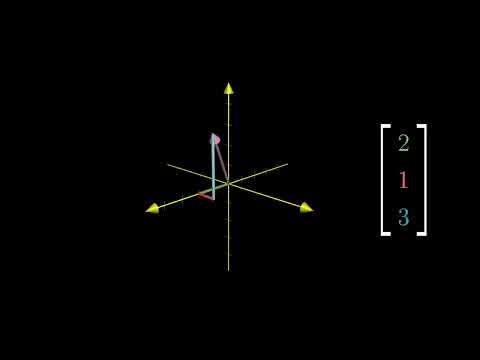
Vectors | Chapter 1, Essence of linear algebra
3Blue1Brown
 19:42
But what is the Fourier Transform? A visual introduction.
3Blue1Brown
 18:40
But what is a neural network? | Deep learning chapter 1
3Blue1Brown
 24:26
The Beauty of Bézier Curves
Freya Holmér
 1:13:50
The Continuity of Splines
Freya Holmér
 1:00:43
Jim Simons (full length interview) - Numberphile
Numberphile2
 39:49
Lec 1 | MIT 18.06 Linear Algebra, Spring 2005
MIT OpenCourseWare
 25:16
But how does bitcoin actually work?
3Blue1Brown
4 comments from Hacker News
There’s not really a reasonable continuous analog, IMO (unless you just want to see a single solid blob, like in your picture, but that hides all of the interesting part of the structure). But there are moiré-like patterns. Check out [VIDEO] for some insight based on a related type of diagram (related to a single row at a time from the OP’s diagrams).
How does that work? ... Explanations invited. Hold the 1 fixed. Notice in both sequences the remaining numbers are 3 interleaved ordered sets, in multiples of 2. Then watch this (just happened to post it two hours ago too)... "Times Tables, Mandelbrot and the Heart of Mathematics" [video] [VIDEO] [LINK] NB: And once again we find cycloids hiding underneath it all.
Check out some of the png files to view the art! This YouTube video explains the algo behind what you're seeing. [VIDEO]
Grasping the concept of number regardless of base system is an interesting exercise (linked to modular arithmetic), see Mathologer on times tables in any number base: [VIDEO]